Objective
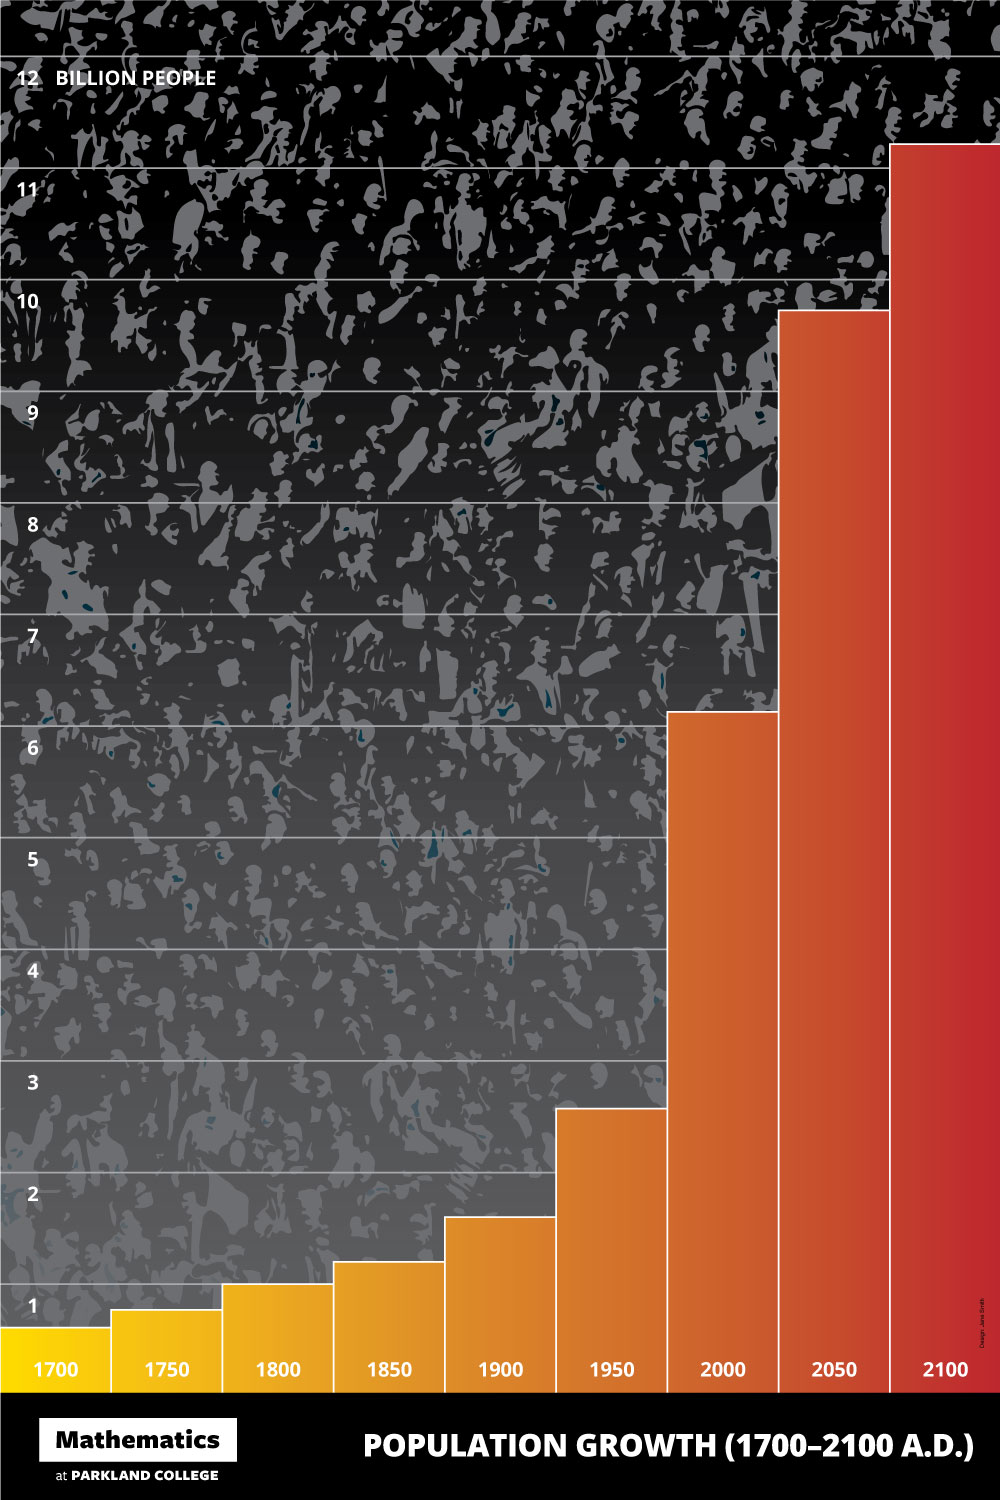
To be introduced to Photoshop and Illustrator tools for graphing and layout. To recreate the
above poster design.
Discussion
Information graphics is a unique specialty of the graphic design profession. Infographics is simply data made visual. Good infographics requires simplication of data by eliminating useless information and enhancing useful information. Graphs and charts are classic examples of infographics where the designer is able to persuasively communicate a specific point of view utilizing the power of design principles.
Also see downloading legal stock images (FAQ)
Procedure
Prepping for the exercise
- download starter files
- download Open Sans from Font Squirrel; turn on using Font Book
- browse to www.worldometers.info; pull slider to 1700
- browse to www.worldometers.info; select data, copy
- launch Excel; paste; save as "growth.xls"
- delete unneeded data, simplify (every 50 years)
- browse to en.wikipedia.org; copy/paste data for 2050 and 2100
- data > sort: by year (smallest to largest)
- clean up data: remove 000,000,000; put years in quotes
- copy to clipboard
Creating the graph
- open "posterTemplate.pdf"; save as "growth.ai"
- practice Adobe navigation keyboard shortcuts: space = hand;
space + cmd = zoom in; space + cmd + opt = zoom out; cmd + zero
= fit in window
- go to "art layer"
- column graph tool: draw proportional rectangle; paste data, commit (check), close
- object > graph type: graph options
• value axis = both sides
• add legend across top = yes
• column width = 100%
• cluster width = 100%
- object > graph type: left axis
• override calculated values: divisions = 12
• tick marks = full width
- fine-tune graph position (snap lower right)
- scale tool: make larger (origin = lower right)
- window > character (cmd+T): 36pt Open Sans Bold, fill = white, horizontal scale = 100%
- fine-tune grouped type (direct select tool: opt+click multiple times to select groups); adjust position; add "billion people"
- fine-tune strokes: weight = 3pt, white or 40% gray
- fill graph with gradient; save gradient as new swatch
Creating the background art
- browse to images.google.com
- search for "crowd": tools: size = large, usage rights = labeled for reuse with modification
- open "pexels-photo-264095.jpeg" in Photoshop; save as "crowd.psd"
- lasso tool: select flaws, edit > fill > content aware (shift+DELETE)
- layer > new adjustment layer > hue/saturation: lower saturation
- layer > new adjustment layer > levels: increase contrast
- save; save as "crowd-high contrast.psd"
- layer > flatten image
- crop tool: double height of canvas
- duplicate layer, adjust position with overlap
- edit transform > flip horizontal
- layer > layer mask > reveal all
- retouch seam: paint on mask with hard edged brush
- new layer; clone stamp tool (sample all layers): opt+click to target pixels, paint to duplicate pixels
- save; save as "crowd-high contrast flattened.psd"
- layer > flatten image
- image > image size: width = 2500px
- save
Finishing the poster
- open "growth.ai"
- new layer "crowd"
- file > place "crowd-high contrast.psd"
- image trace: preset = silhouettes (note: ignore white = yes)
- object > expand
- scale/position
- apply gradient (100-80%)
- new layer "mask"; re-stack to top
- draw white boxes to hide non-printing art
- add your name as design credit
Grading
- save, save as "growth.pdf" ("smallest file size" for web publishing)
- print your exercise on 11x17 paper for grading
- file your graded proofs in your Process Book for individual review
- publish "growth.pdf" as a link from your Process Page