Objective
To learn advanced Illustrator drawing techniques. To learn Illustrator's
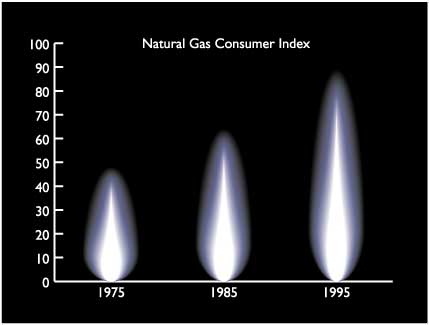
graphing and blending tools by recreating the following art:
Discussion
Illustrator's graphing capabilities gives artists full control
over how graphs look. An illustrated graph (as opposed to a plain
bar graph) can convey numerical information in a much more interesting
way. In this example, we will make the flame art by blending objects.
Then we will apply the art to a generic bar graph using
imported data.
Procedure
making the graph
- download starter files
- open "gas index.xls" in excel; save as "gas
index.txt" (text, tab delimited)
- launch Illustrator, file > new (profile=print), save as "graph.ai"
- practice Illustrator's navigation shortcuts (download
Illustrator keyboard shortcuts)
- column graph tool: draw rectangle:
• import "gas index.txt",
apply
• transpose row/column, apply
- with graph selected, object > graph > type:
• graph options:
column width=60, cluster width=100
• value axis: 0, 100, 10
•
category axis: tick marks=none
making the flame
- open "flame.ai", examine layers
- flame white layer: fill white, stroke none
- flame blue layer: fill=50C+35M+25K; stroke none
- flame black layer: fill= 50C+35M+100K, stroke none
- hide bottom layer, select all
- object > blend > make (resulting blend will be on top
layer)
- copy and paste blended object into "graph" window,
move to side
making a better graph
- select flame art
- object > graph design: new design, rename "flame"
- select graph, object > graph > column: choose flame
- new layer "black", draw black rectangle, move to
bottom
- change fill to rich black (match flame)
- view > outline (cmd+Y)
- direct select tool: select one type element
- select > same > fill color
- change font to Gill Sans, fill=white (adjust
size)
- direct select tool: select one tick mark
- select > same > stroke color
- stroke=white;
width=2pt
- new layer "title", add title "Natural Gas Consumer
Index"
- save
grading
- file > save as (format=PDF)
- delete unused art
- add your name and the exercise number to the file
- print a b&w proof for grading
- file your graded proof in your Process Book for individual review